Introduction
With increasing environmental pressure on rivers and their ecosystems, there is a need for simple, robust tools to support environmental management decision-making. the Water Framework Directive (WFD) requires member states to bring rivers to Good Ecological Status by reviewing existing activities and taking remedial action (European Union 2000).
Maps of habitats across river networks would help diagnose environmental problems and plan for the delivery of improvement work. Existing habitat mapping methods are generally time consuming, require experts and are expensive to implement.
As part of a previous research project, we developed an approach towards mapping hydromorphological elements across entire river networks that does not require continuous surveys of river catchments, but makes use of existing semi-quantitative survey data, GIS, linear regression and geostatistical techniques. This paper briefly covers the indices derivation and their significance.
Methods summary
The principle of the method is to identify and define habitat indices representing major dimensions in habitat distribution using multivariate statistical analysis applied to existing habitat data taken from the River Habitat Survey (RHS). The habitat indices are predicted using standard linear regression models using GIS map-derived covariates such as altitude, slope, distance from source, discharge and geology which represent known drivers of habitat/geomorphological change. The model outputs are then analysed using geostatistical techniques to identify and explain any remaining spatial variance and patterns not explained by the regression. The final model is then applied to the entire river network by deriving GIS covariates at regular intervals on the network (e.g. 500 m). For more information on methods see Naura et al (submitted). Two sets of models were produced, one based on all existing RHS data and the other on a subset of sites with little or no modifications (i.e. semi-natural sites).
Hydromorphological indices
Four indices were derived using RHS semi-quantitative spot-check data, the
- Channel Substrate Index (CSI),
- Geomorphic Activity Index (GAI),
- Flow Regime Index (FRI), and
- Channel Vegetation Index (CVI).
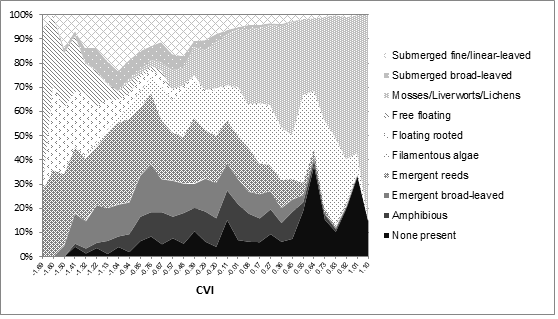
The indices represent major dimensions in the distribution of hydromorphological features. The following figures illustrate, for each index, the relative occurrence of constituting hydromorphological features along the indices scales. The indices and figures were built using RHS semi-natural sites with little or no signs of channel/bank modification.
- The Channel Substrate Index represents a gradient in average channel substrate size. The gradient is correlated with measures and attributes relating to stream power, shear stress, climate and sediment supply. At the lower end of the scale, sites are dominated by fine substrate. As we progress through the scale, we see a gradual increase in average sediment size and a shift towards coarser substrate types.
- The Flow Regime Index represents a gradient between slow tranquil and fast turbulent flow-types. The index ranges from sites dominated by slow flowing less turbulent features such as glides and pools to sites dominated by fast flowing features such as waterfalls, cascades and rapids. The gradient is strongly correlated to measures of discharge and slope as well as altitude and geology.
- The Geomorphic Activity Index represents a gradient of increased activity. It is based on the relative occurrence of erosion and deposition features such as bars, cliffs, riffles and pools. Sites at the bottom of the scale display few or no signs of activity whilst sites at the upper-end of the scale are dominated by active erosion and deposition features. The index is not simply a representation of the number of eroding/depositing features, it also differentiates between types of activity. The lower end of the scale displays a higher proportion of stable erosion and deposition features (i.e. stable cliffs and vegetated bars) compared to the upper end of the scale which is dominated by more active features (i.e. eroding cliffs and unvegetated bars). The GAI was correlated to measures of stream power, shear stress as well as attributes relating to climatic, land-use and geological controls.
- The Channel Vegetation Index follows a gradient of flow velocity, energy and channel condition. The lower end of the scale is dominated by floating vegetation typical of slow flowing environments with stable hydrographs. As we progress along the scale, submerged and emergent vegetation types become dominant followed by filamentous algae, mosses, liverworts and lichens. The CVI gradient is strongly correlated with stream energy, geology and altitude.
Models
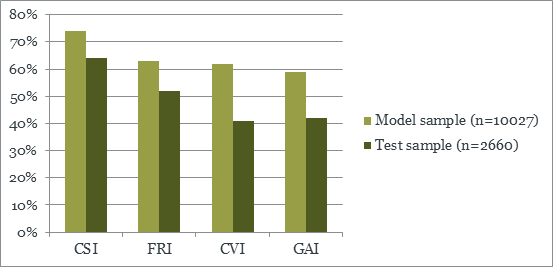
Predictive models results for all RHS sites (including modified sites) and semi-natural sites are displayed in the following two figures. All models were tested on an independent set of RHS sites from the 2007-2009 baseline survey for their predictive ability in space and time.
Prediction of index values for four hydromorphological indices using all RHS sites. Amount of variability explained by the models on the validation and test samples (R2).
Altogether, the model predictions were satisfactory with marked improvements in predictive power achieved through spatial correction. Model R2 were generally high for all indices across samples. The model performance on a separate sample of sites were comparable with some decrease in predictive power that could be attributed to differences between years and time of survey as well as changes in sampling strategy (the 2007-9 baseline survey included sites from the 1/50,000 scales network less than 1m wide not present in the original sample). Best results were achieved for CVI and FRI predictions with higher levels of residual variability observed for CVI and GAI.
Prediction of index values for four hydromorphological indices using RHS semi-natural sites. Amount of variability explained by the models on the validation and test samples (R2).

Maps
The models were implemented across the entire river network. The following figure shows the map for the Channel Substrate Index (all sites) across England & Wales.
Map of predicted values of CSI using regression kriging at every 500m across the 1/50,000 river network on a gradient from bedrock/boulder (blue) to gravel-pebble (green) and silt-sand-clay (brown). White reflects areas of low drainage density where fewer streams are present.
Conclusion
We developed an approach for mapping habitat elements across entire river networks that makes use of existing semi-quantitative survey data, GIS map-based covariate data and geostatistics. A set of new national scale indices were produced, which are accurate from 500m up to national scales. Models predicted observable hydomorphological as well as semi-natural conditions with adequate accuracy. This application shows the potential of using spatially explicit techniques for modelling river attributes at the national scale for assessing hydromorphological conditions and departure from natural state.
Acknowledgements
Part of this work was carried out as part of an EPSRC funded fellowship at the University of Southampton (Faculty of Engineering and the Environment) as well as funding from the School of Geography, the Environment Agency and the Scottish Environment Protection Agency.
Published in Ecological Indocators: Mapping habitat indices across river networks using spatial statistical modelling of River Habitat Survey data. Ecological Indicators 2016), pp. 20-29 DOI information: 10.1016/j.ecolind.2016.01.019. Temporary link to full copy of publication: Link.
References
Collins, A.L., Jones, J.I., Sear, D.A., Naden, P.S., Skirvin, D., Zhang, Y.S., Gooday, R., Murphy, J., Lee, D., Pattison, I., Foster, I.D.L., Williams, L.J., Arnold, A., Blackburn, J.H., Duerdoth, C.P., Hawczak, A., Pretty, J.L., Hulin, A., Marius, M.S.T., Smallman, D., Stringfellow, A., Kemp, P., Hornby, D., Hill, C.T., Naura, M. and Brassington, J. (2012). Extending the evidence base on the ecological impacts of fine sediment and developing a framework for targeting mitigation of agricultural sediment losses. Final report to Defra, Defra project WQ0128.
European Union (2000) Directive 2000/60/EC of the European Parliament and of the Council of 23 October 2000 establishing a framework for Community action in the field of water policy.
Naura, M., Clark, M.J., Sear, D.A., Atkinson, P.M., Hornby, D.D., Kemp, P., England, G., Peirson, G., Bromley, C. & Carter, M.G. (submitted) Mapping habitat indices across river networks using regression kriging and semi-quantitative data: an example applied to channel substrate in English and Welsh rivers. Ecological Indicators.


You must be logged in to post a comment.